Demographics of the TIMSS 2015 Countries
The TIMSS 2015 participants were from all around the world (on every continent except Antarctica), and represented a wide range of geographic and economic diversity. Because such factors as population size and economic resources can impact educational policies, the following table presents selected information about the demographic and economic characteristics of the TIMSS 2015 countries, primarily taken from the World Bank’s World DataBank. It can be seen that the TIMSS 2015 countries vary widely in population size and geographic area, as well as in population density. The countries also vary considerably on indicators of health, such as life expectancy and infant mortality rate. Nearly all the countries had life expectancies of 69 to 84 years, except Botswana (64) and South Africa (61), and the majority had infant mortality rates of 2 to 15 out of 1,000 births. However, Botswana, Egypt, Indonesia, Morocco, and South Africa had higher infant mortality rates—20 to 36 out of 1,000 births.
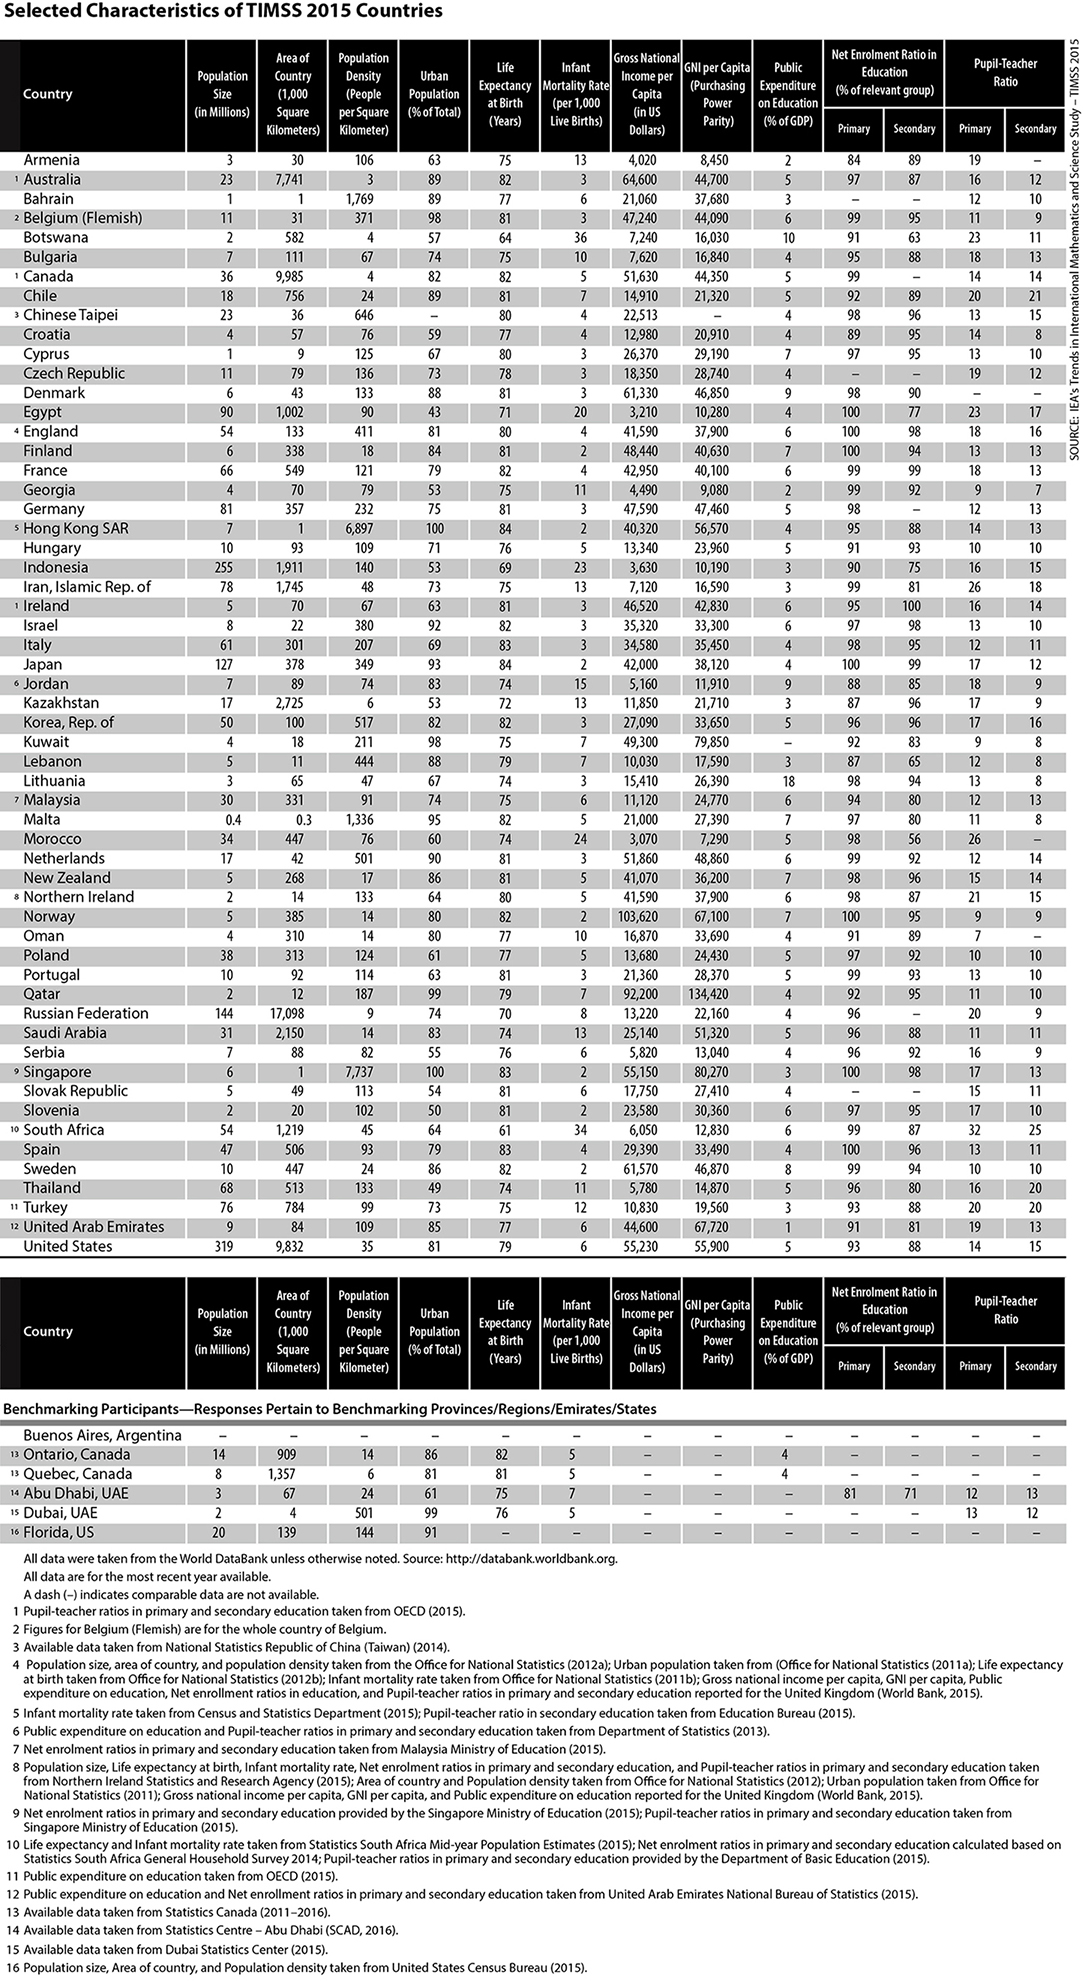
Economic indicators, such as the data for gross national income per capita, reveal great disparity in the economic resources available among TIMSS 2015 countries, as well as differences in policies regarding the percentage of funds spent on education. Economically, the countries ranged from Kuwait, Qatar, and Singapore with relatively high gross national incomes per capita (about $80,000 USD or higher, adjusted for purchasing power parity) to Armenia, Egypt, Georgia, Indonesia, and Morocco with relatively low gross national incomes per capita (about $10,000 USD or less, adjusted for purchasing power parity). Although more than half of the countries had 95 percent or more of their primary students enrolled in school, there was some degree of variation in enrollment rates, especially in secondary school. However, more than half the countries had 85 percent or more of their students at secondary level age enrolled in school.